![]()
![]()
![]()
![]()
![]()
![]()
![]()
![]()
If no levels are selected, a plot showing the distribution of level energies versus spin will be drawn:
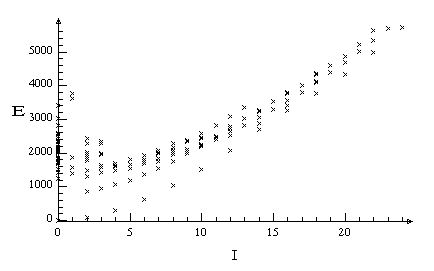 |
By clicking the I on the horizontal axis and selecting I(I+1), the distribution is plotted against I(I+1). The scale on any axis can be manually selected in a dialog box which appears when you click on any of the axes.
If bands have been selected, a band plot will be generated:
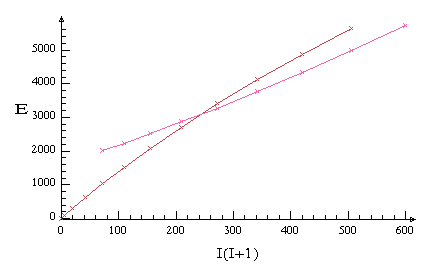 |
Here, two bands (the G band and the S band) were selected. For band plots the following axis variable are available:
Comments to:
F Chu (program),
P Ekström (manual)
All contents copyright © 1996, Isotopes Project, Berkeley Lab. All rights reserved.
Revised: