 On selecting Data, Select Band(s) in level scheme mode,
the band selection panel shown on the right is displayed.
The bands in the current data sets will be displayed in
the list. The user can select any band or bands by clicking on
entries in the list. When the OK button is selected, a
level scheme in the band mode will be displayed.
In the band mode, the bands are displayed separately from each other:
 |
The order of the bands is determined by optimizing the out of band transitions. When there is feeding between non-adjacent bands, the level fed is extended horizontally with a gray line. Levels from non-selected bands which are fed from selected bands, are shown as horizontal gray lines of the full width of the display.
At present levels and gammas can not be selected in band mode, but the properties of the gammas (gamma-ray energy, initial/final level energy and spin-parity, relative intensity and multipolarity) is displayed in the status bar at the bottom of the screen when the mouse is on top of a gamma.

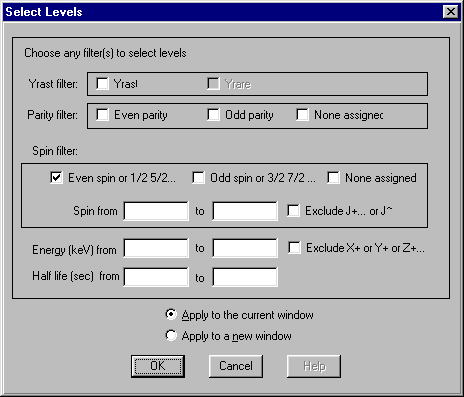
The panel contains a number of filters that can be applied to the selection of levels:
Comments to:
F Chu (program),
P Ekström (manual)
All contents copyright © 1996, Isotopes Project, Berkeley Lab. All rights reserved.
Revised: