 The simplest way to show coincidences is to select one gamma
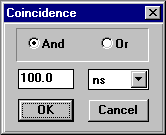
(or several gammas) with the arrow cursor and click the
On OK, the program will display all gammas in the current selection (data set, if no band
has been selected) that are in coincidence with the selected gamma within the specified time gate.
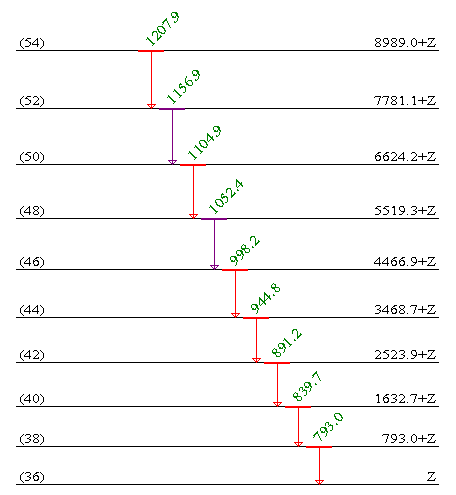
Coincident gammas are displayed in red, and gating gammas in blue.
If more than one gamma is selected, the displayed coincidences
correspond to OR or AND operations with
the gates. In the picture below, gates have been set on two transitions with the OR
condition selected. Since the gating transitions are in coincidence,
they are shown in purple rather than blue:
 |
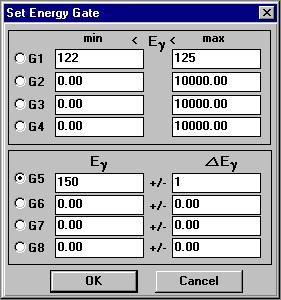
 The user may also specify gates, either as an energy interval or an energy with a width,
by selecting Operation, Energy Gate:
In the example above the gate G1 is set between 122 and 125 keV. The gate G5 is
set as 150 +-1 keV, i.e. 149-151 keV. The user can set all the gates G1-G8, and
then perform operations on them (see below). The
gates G1-G4 and G5-G8 are equivalent - the gating condition is just
specified in different ways.
The user should note the difference between selecting a particular gamma
with the cursor and setting an energy gate. In the former case, only the
selected gamma is used for coincidences. In the latter case, more than one
gamma may be within the energy gate. In that case, the coincidences shown will
correspond the sum of the coincidences of the individual gammas.
More advanced operations can be performed with the Logical operations option described in the next section.
Comments to:
F Chu (program),
P Ekström (manual)
All contents copyright © 1996, Isotopes Project, Berkeley Lab. All rights reserved.
Revised: